AI infographic examples, with the text behind them
Most galleries show the picture and hide the prompt. Here every infographic sits next to the exact text it was made from, so you can judge what you would get from your own content.
AI infographic generator
How AI infographic generator worksTHE TEXT THAT WAS PASTED
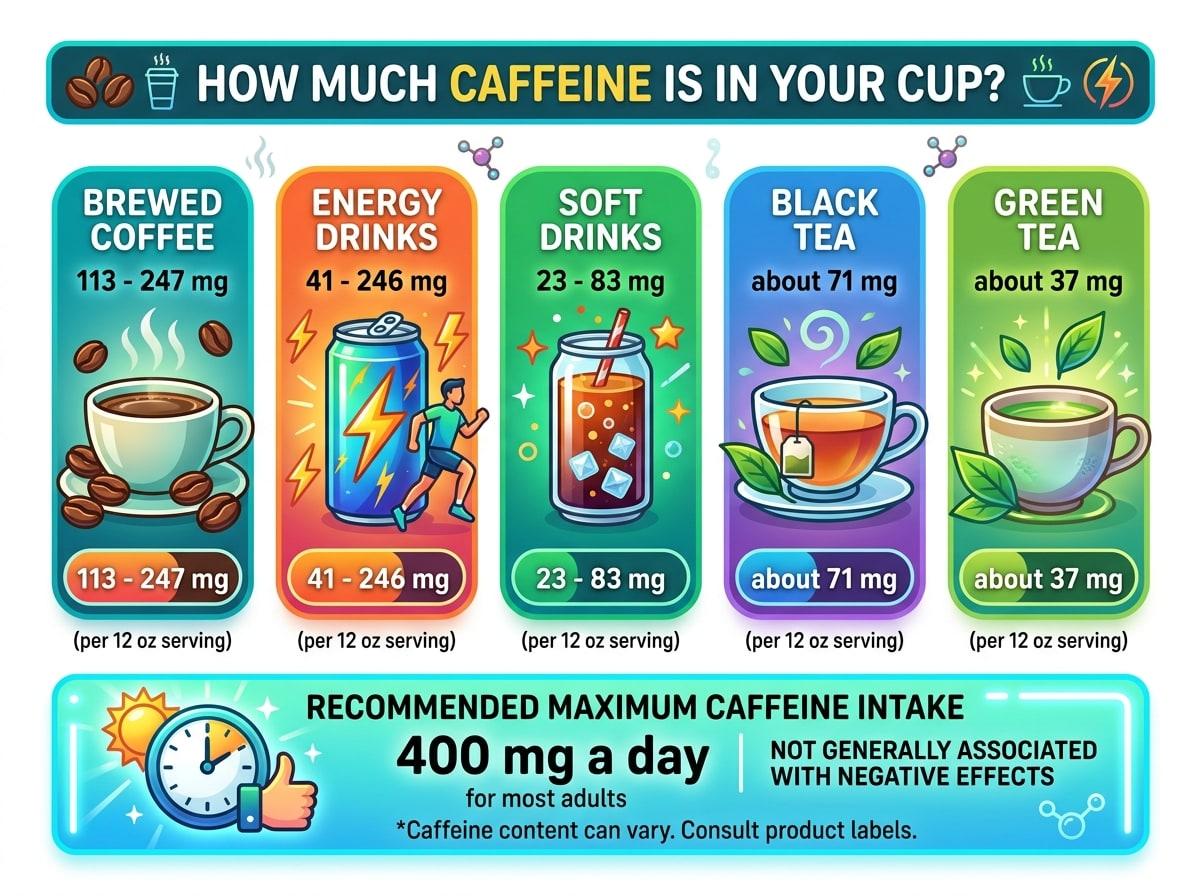
How much caffeine is in your cup? Caffeine per 12 oz serving, according to the FDA: brewed coffee has 113 to 247 mg, energy drinks 41 to 246 mg, soft drinks 23 to 83 mg, black tea about 71 mg and green tea about 37 mg. For most adults, 400 mg a day is not generally associated with negative effects.
PDF to infographic
How PDF to infographic worksTEXT EXTRACTED FROM THE PDF
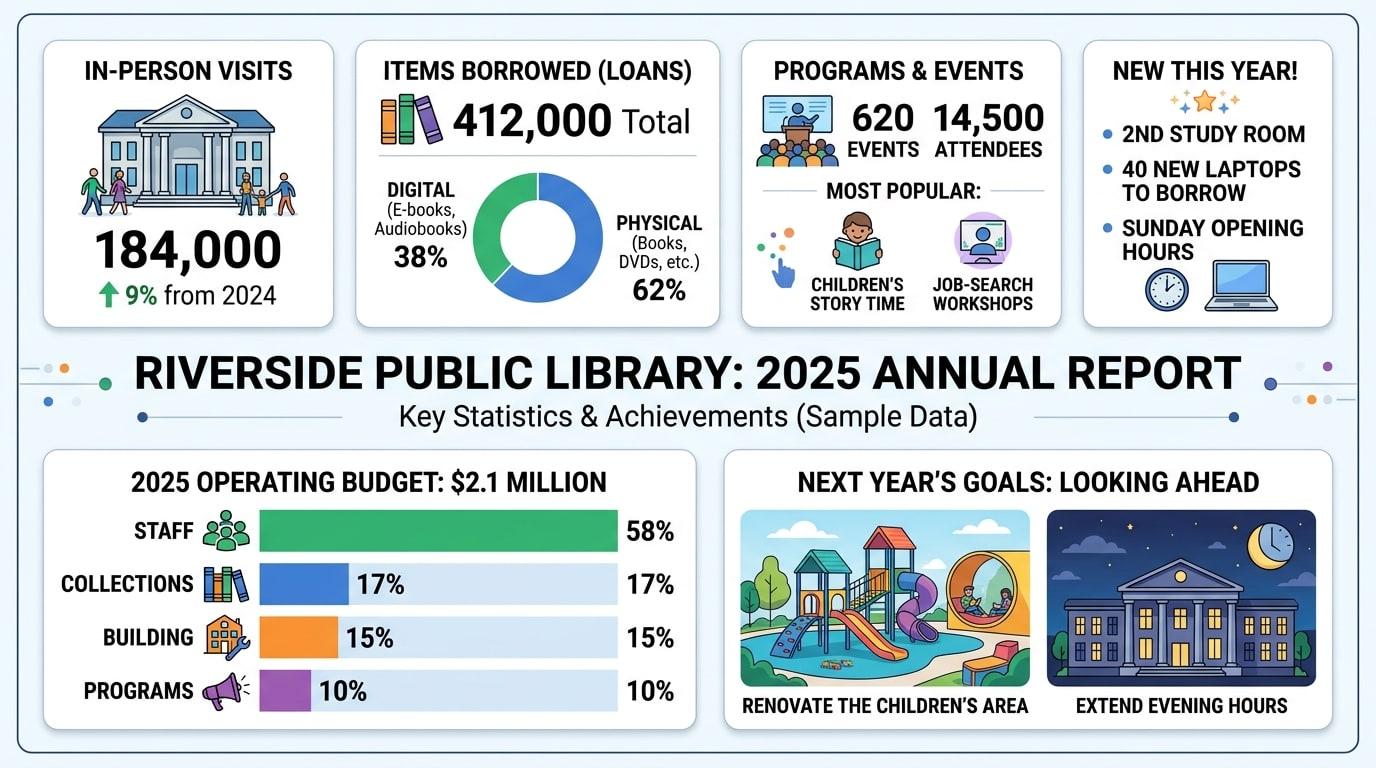
Riverside Public Library, 2025 annual report (sample data) Visits: 184,000 in-person visits, up 9% from 2024. Loans: 412,000 items borrowed. E-books and audiobooks were 38% of all loans. Programs: 620 events with 14,500 attendees. Most popular: children's story time and job-search workshops. New this year: a second study room, 40 new laptops to borrow, and Sunday opening hours. Budget: $2.1 million. Staff 58%, collections 17%, building 15%, programs 10%. Next year: renovate the children's area and extend evening hours.
Meeting notes to infographic
How meeting notes to infographic worksTHE NOTES THAT WERE PASTED
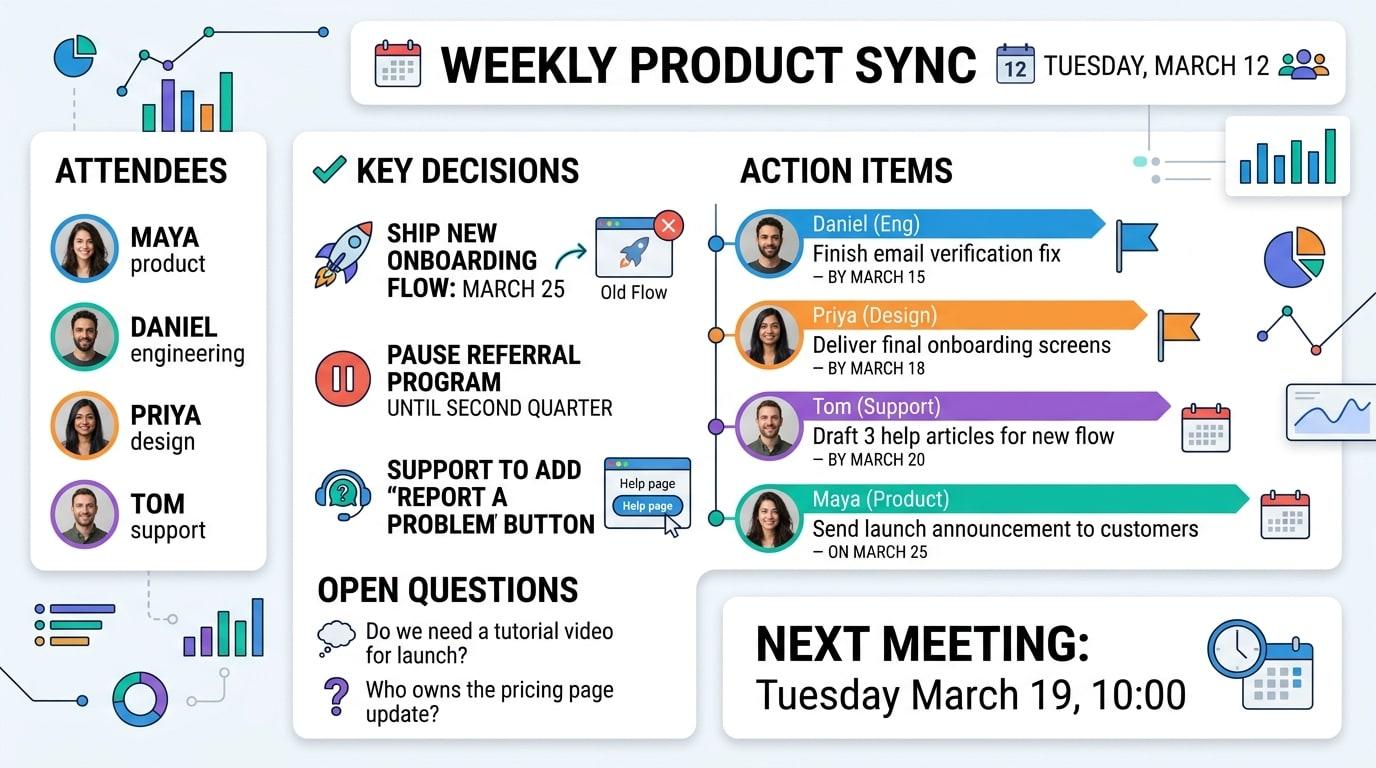
Weekly product sync, Tuesday March 12 (sample notes) Attendees: Maya (product), Daniel (engineering), Priya (design), Tom (support). Decisions: 1. Ship the new onboarding flow on March 25. The old flow is switched off the same day. 2. Pause work on the referral program until the second quarter. 3. Support will add a "report a problem" button to the help page. Action items: - Daniel: finish the email verification fix by March 15. - Priya: deliver final onboarding screens by March 18. - Tom: draft three help articles for the new flow by March 20. - Maya: send the launch announcement to customers on March 25. Open questions: - Do we need a tutorial video for launch? - Who owns the pricing page update? Next meeting: Tuesday March 19, 10:00.
Transcript to infographic
How transcript to infographic worksTHE TRANSCRIPT THAT WAS PASTED
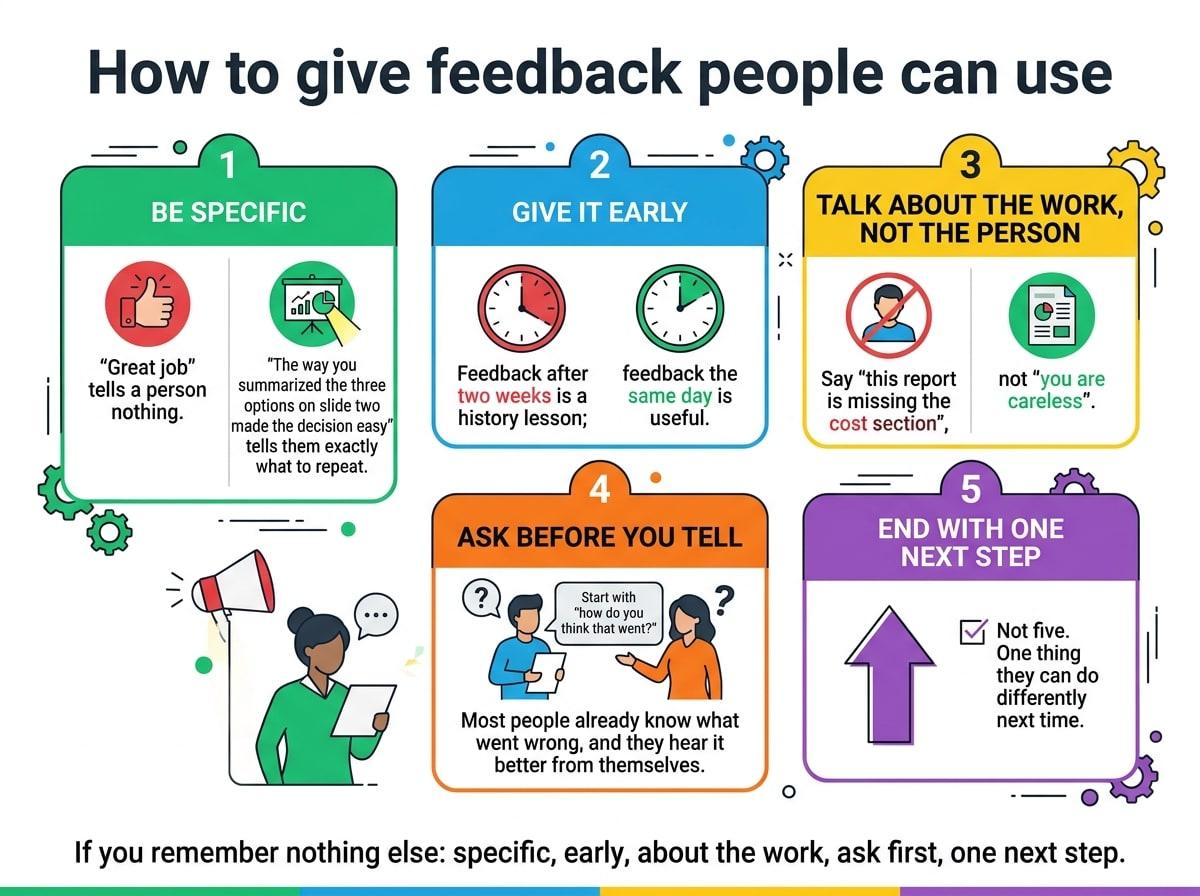
Transcript excerpt (sample): "How to give feedback people can use" ...so the first thing I tell new managers is: be specific. "Great job" tells a person nothing. "The way you summarized the three options on slide two made the decision easy" tells them exactly what to repeat. Second, give it early. Feedback after two weeks is a history lesson; feedback the same day is useful. Third, talk about the work, not the person. Say "this report is missing the cost section", not "you are careless". Fourth, ask before you tell. Start with "how do you think that went?" Most people already know what went wrong, and they hear it better from themselves. And fifth, end with one next step. Not five. One thing they can do differently next time. If you remember nothing else: specific, early, about the work, ask first, one next step.
Timeline infographic maker
How timeline infographic maker worksTHE TEXT THAT WAS PASTED
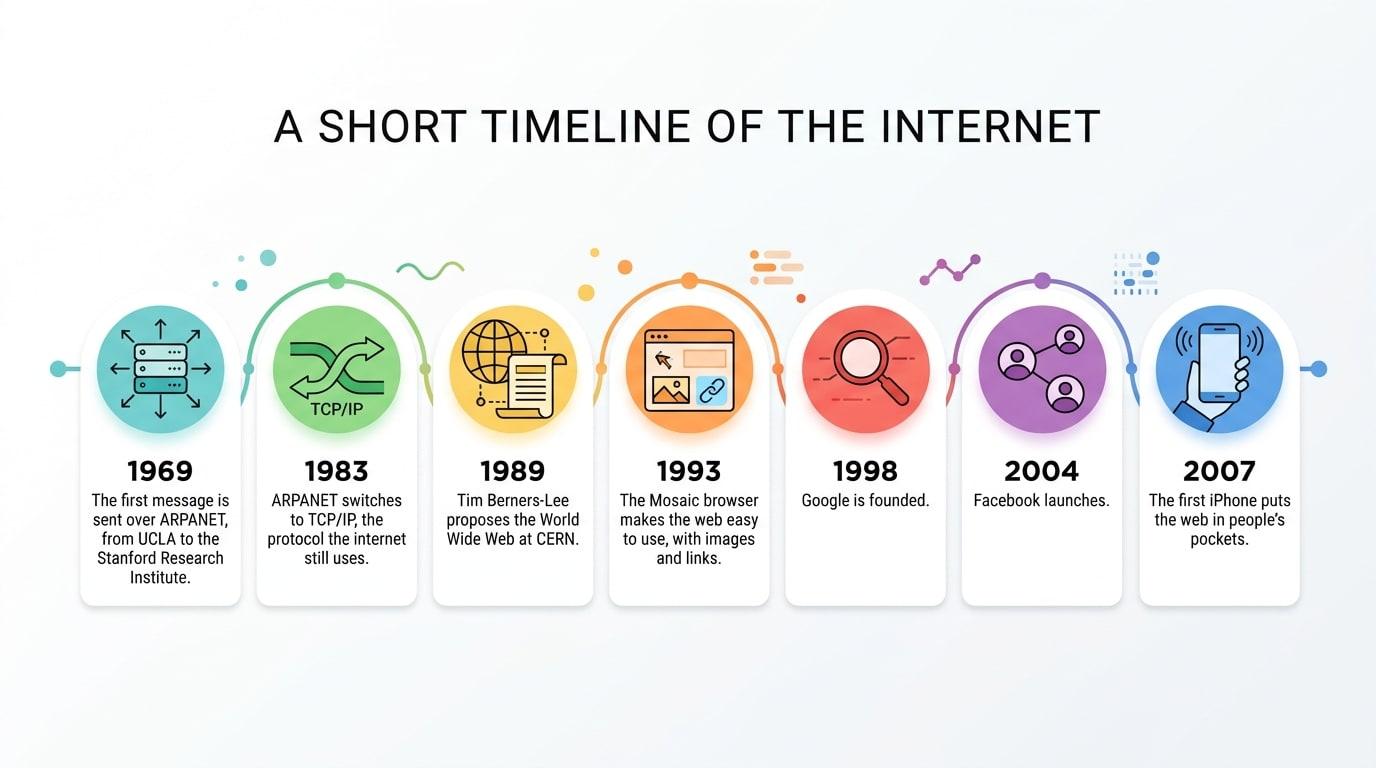
A short timeline of the internet 1969: The first message is sent over ARPANET, from UCLA to the Stanford Research Institute. 1983: ARPANET switches to TCP/IP, the protocol the internet still uses. 1989: Tim Berners-Lee proposes the World Wide Web at CERN. 1993: The Mosaic browser makes the web easy to use, with images and links. 1998: Google is founded. 2004: Facebook launches. 2007: The first iPhone puts the web in people's pockets.
Infographics for teachers
How infographics for teachers worksTHE LESSON NOTES THAT WERE PASTED
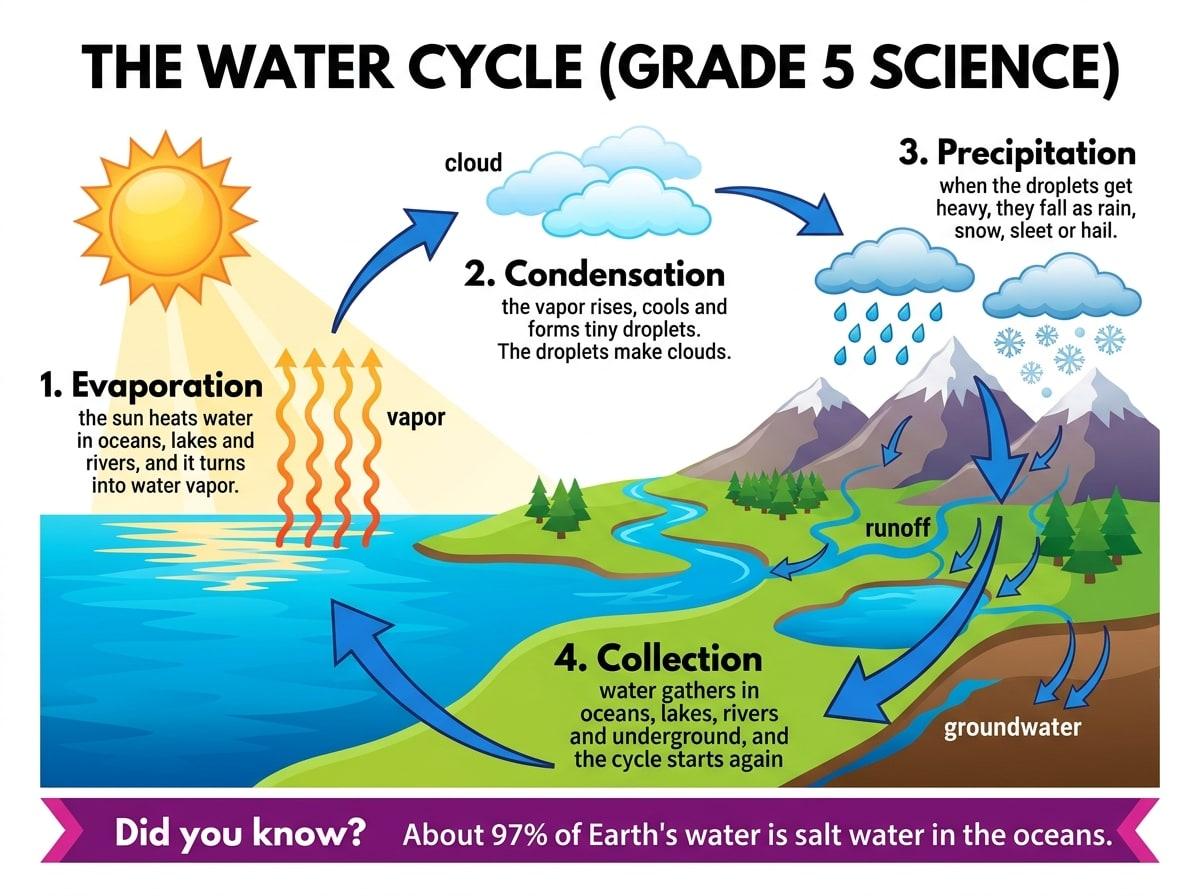
The water cycle (Grade 5 science) 1. Evaporation: the sun heats water in oceans, lakes and rivers, and it turns into water vapor. 2. Condensation: the vapor rises, cools and forms tiny droplets. The droplets make clouds. 3. Precipitation: when the droplets get heavy, they fall as rain, snow, sleet or hail. 4. Collection: water gathers in oceans, lakes, rivers and underground, and the cycle starts again. Key words: vapor, cloud, groundwater, runoff. Did you know? About 97% of Earth's water is salt water in the oceans.
Book summary infographic
How book summary infographic worksTHE SUMMARY THAT WAS PASTED
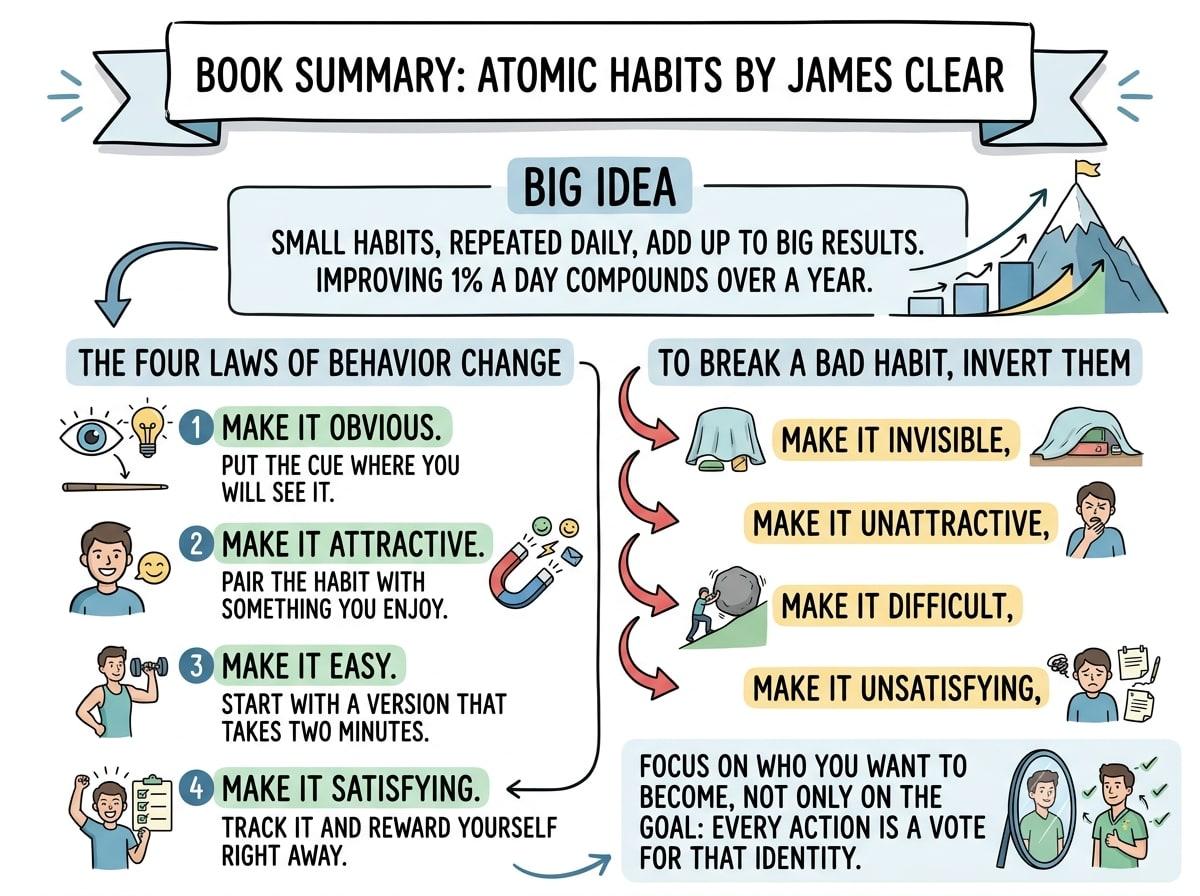
Book summary: Atomic Habits by James Clear Big idea: small habits, repeated daily, add up to big results. Improving 1% a day compounds over a year. The four laws of behavior change: 1. Make it obvious. Put the cue where you will see it. 2. Make it attractive. Pair the habit with something you enjoy. 3. Make it easy. Start with a version that takes two minutes. 4. Make it satisfying. Track it and reward yourself right away. To break a bad habit, invert them: make it invisible, unattractive, difficult and unsatisfying. Focus on who you want to become, not only on the goal: every action is a vote for that identity.
Try it with your own text
Your first infographic is free, no card needed. After that, packs start at $6.99 for 5. No subscription.