Infographic maker for teachers, lesson notes to classroom visual
Paste the key points of a lesson and get a visual you can project, print or post in your class space. No design work and no template hunting.
Make my first one free- 1 free infographic
- No card needed
- Then pay once, no subscription
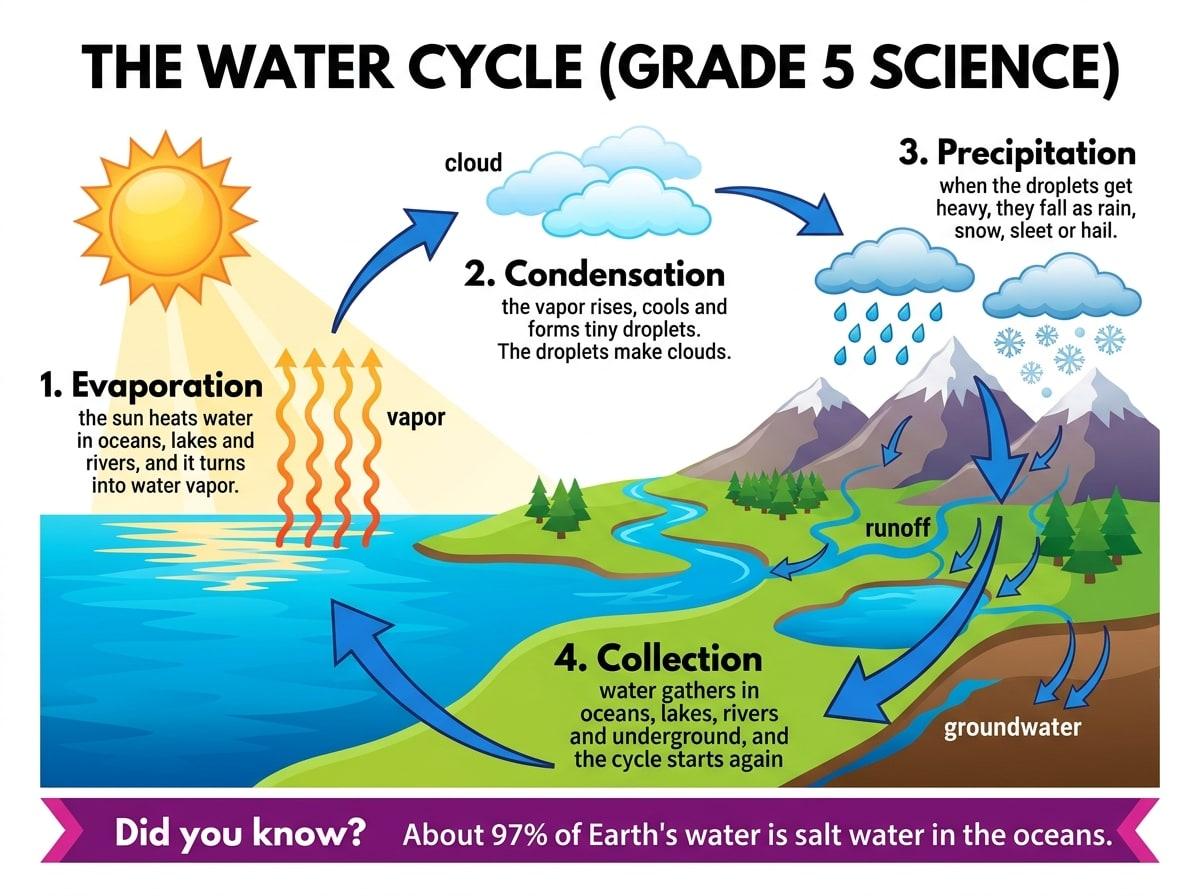
A REAL EXAMPLE: THE TEXT, AND WHAT CAME OUT
THE LESSON NOTES THAT WERE PASTED
The water cycle (Grade 5 science) 1. Evaporation: the sun heats water in oceans, lakes and rivers, and it turns into water vapor. 2. Condensation: the vapor rises, cools and forms tiny droplets. The droplets make clouds. 3. Precipitation: when the droplets get heavy, they fall as rain, snow, sleet or hail. 4. Collection: water gathers in oceans, lakes, rivers and underground, and the cycle starts again. Key words: vapor, cloud, groundwater, runoff. Did you know? About 97% of Earth's water is salt water in the oceans.
How it works
- 1
Paste your lesson points
A numbered process, key vocabulary, a comparison or a short summary of the unit.
- 2
Choose the look
Colorful and Cheatsheet suit younger classes, Modern and Minimal older ones. Pick 4:3 or 16:9 to project, 4:5 to print.
- 3
Use it in class
Download the PNG and add it to your slides, print it as a handout or post it in your learning platform.
Where teachers use it
- Processes and cycles: the water cycle, photosynthesis, how a bill becomes law.
- Vocabulary and key facts for a unit, as a one-page study sheet.
- Timelines for history and literature.
- Classroom rules, lab safety steps and project instructions.
What to know before you start
- Always proofread before showing it to students. AI images can contain a misspelled word, and a typo on a classroom poster gets noticed.
- Diagrams are illustrative, not scientifically exact drawings. For anatomy or maps, check the picture as well as the words.
- Do not paste student names or personal data.
Questions about infographics for teachers
Is there a free infographic maker for teachers?
TextToInfographic gives every new account 1 free infographic, with no card needed. After that it is pay-per-pack, from $6.99 for 5, with no subscription. There is no separate education plan.
Can students use it for school projects?
Yes. Students paste their own research notes and get a visual for a project or presentation. They should still write the content themselves and list their sources.
What size should a classroom infographic be?
For projecting, use 16:9 or 4:3 to match the screen. For printing on Letter or A4 paper, 4:5 or 3:4 portrait fits best. For a learning platform or newsletter, 1:1 or 4:5 is easy to read on a phone.
More ways to use it
- Timeline infographic maker
- Book summary infographic
- PDF to infographic
- AI infographic generator
- All examples
Have the text ready?
Your first infographic is free, no card needed. After that, packs start at $6.99 for 5. No subscription.