AI timeline infographic maker, from a list of dates
Paste dates and what happened on them. You get a finished timeline infographic: events in order, each with an icon and a short description.
Make my first one free- 1 free infographic
- No card needed
- Then pay once, no subscription
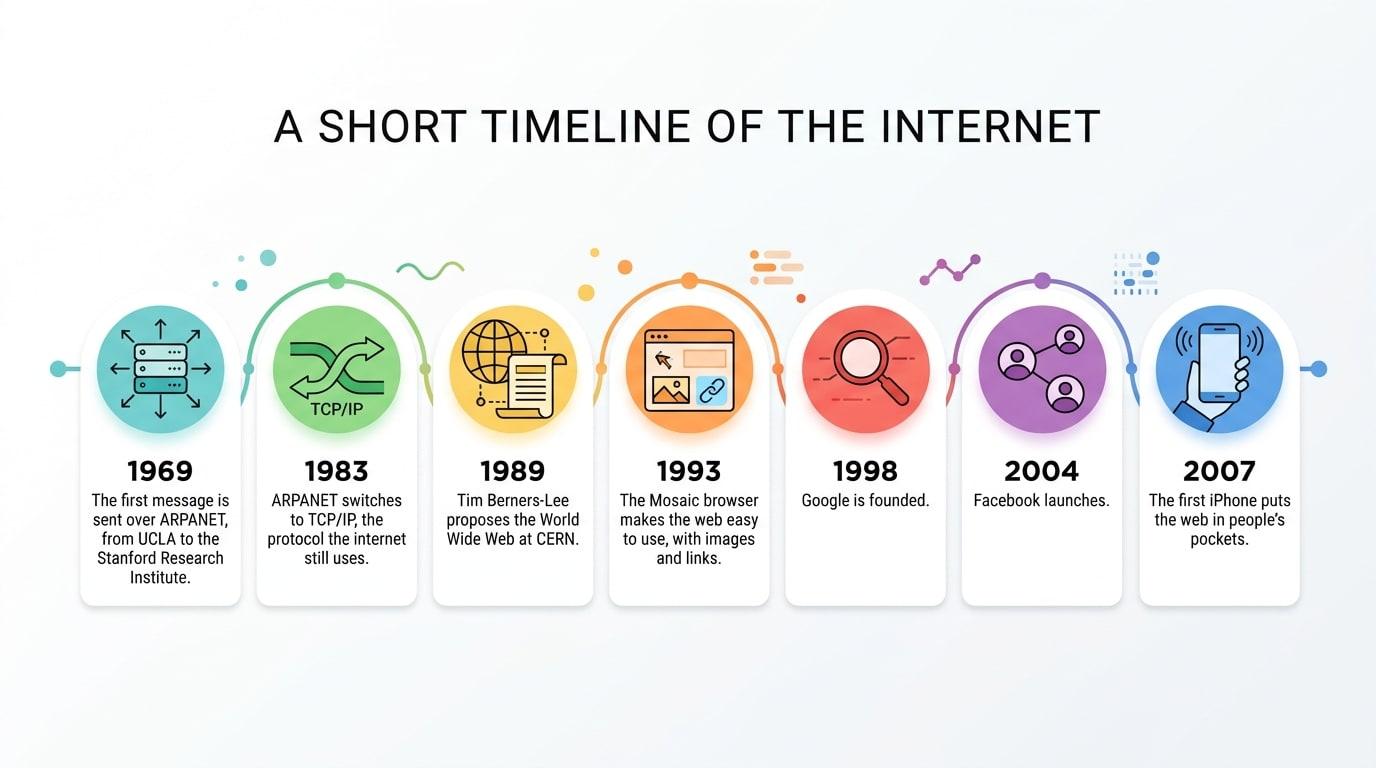
A REAL EXAMPLE: THE TEXT, AND WHAT CAME OUT
THE TEXT THAT WAS PASTED
A short timeline of the internet 1969: The first message is sent over ARPANET, from UCLA to the Stanford Research Institute. 1983: ARPANET switches to TCP/IP, the protocol the internet still uses. 1989: Tim Berners-Lee proposes the World Wide Web at CERN. 1993: The Mosaic browser makes the web easy to use, with images and links. 1998: Google is founded. 2004: Facebook launches. 2007: The first iPhone puts the web in people's pockets.
How it works
- 1
List your events
One line per event, starting with the date or year, then what happened.
- 2
Choose the look
Minimal and Modern keep a timeline clean. 16:9 suits a horizontal timeline, 4:5 or 9:16 a vertical one.
- 3
Download the PNG
Use it in a presentation, a report, a lesson or a post.
Timelines that read well
- Five to eight events is the sweet spot. More than ten gets crowded in one image.
- Start every line with the date. "1998: Google is founded" is clearer to the AI than a date buried in a sentence.
- Keep each event to one short sentence.
- Works for history lessons, project plans, product roadmaps, company milestones and personal resumes.
What to know before you start
- Spacing between events is visual, not to scale: 1969 to 1983 can look as wide as 2004 to 2007.
- It does not look up dates. The timeline shows what you give it, so check your facts first.
- For a very long history, split it into periods and make one timeline for each.
Questions about timeline infographic maker
How do I make a timeline infographic with AI?
Write your events as a list, one per line with the date first, paste the list into TextToInfographic and generate. Add "Make it a timeline" in extra instructions if your text is not already a list of dates.
Should a timeline be horizontal or vertical?
Horizontal (16:9) fits slides and wide screens and works for up to about eight events. Vertical (4:5 or 9:16) fits phones and social feeds and has room for longer descriptions.
Can I use it for a project timeline or roadmap?
Yes. List the milestones with their dates or quarters. Because the result is an image, it suits a status update or a kickoff slide better than a plan you need to keep editing.
More ways to use it
Have the text ready?
Your first infographic is free, no card needed. After that, packs start at $6.99 for 5. No subscription.