PDF to infographic, from report to one page
Upload a report, a paper or a handout. The text is pulled out of the PDF, condensed to its key points and drawn as an infographic you can download as a PNG.
Make my first one free- 1 free infographic
- No card needed
- Then pay once, no subscription
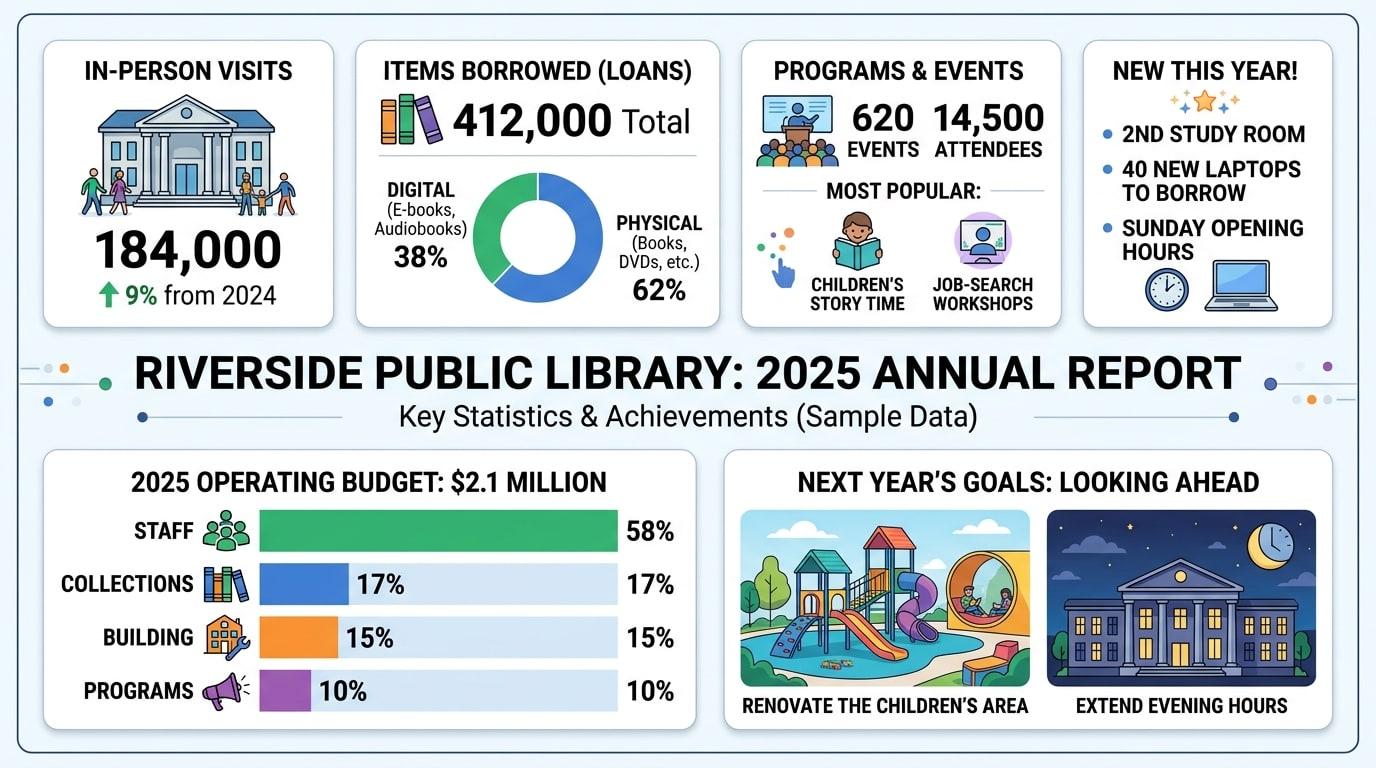
A REAL EXAMPLE: THE TEXT, AND WHAT CAME OUT
TEXT EXTRACTED FROM THE PDF
Riverside Public Library, 2025 annual report (sample data) Visits: 184,000 in-person visits, up 9% from 2024. Loans: 412,000 items borrowed. E-books and audiobooks were 38% of all loans. Programs: 620 events with 14,500 attendees. Most popular: children's story time and job-search workshops. New this year: a second study room, 40 new laptops to borrow, and Sunday opening hours. Budget: $2.1 million. Staff 58%, collections 17%, building 15%, programs 10%. Next year: renovate the children's area and extend evening hours.
How it works
- 1
Upload the PDF
Choose a PDF up to 10 MB. The text is read from the file in your browser and used to make the infographic.
- 2
Check the text and choose the look
You see the text that was found. Pick a style, a background and an aspect ratio, and how many infographics you want.
- 3
Download the PNG
One infographic shows the key points. For a long PDF, ask for several and each one covers its own part.
Getting a good result from a PDF
- Reports, research summaries, policy documents, handouts and exported slides work best: PDFs with real, selectable text.
- For a long document, make several infographics instead of one. Each covers a part of the text in more detail.
- Use the extra instructions box to steer it, for example "Focus on the budget figures" or "Make it a timeline".
- Have a PowerPoint or Word file? Export it as a PDF first, then upload it here.
What to know before you start
- Scanned PDFs that are only images have no text to read, so they will not work.
- Password-protected PDFs need the password removed first.
- Tables and charts inside the PDF are read as text, not as pictures. Numbers are kept, layouts are not.
Questions about PDF to infographic
How do I turn a PDF into an infographic?
Upload the PDF, check the extracted text, choose a style and aspect ratio, and generate. You get a PNG infographic of the document's key points. In TextToInfographic the PDF can be up to 10 MB.
Is my PDF uploaded to a server?
Normally no: the PDF is read in your browser and only the text taken from it is sent to the AI model to generate the infographic. If your browser cannot read the file and it is under 4 MB, it is sent to our server only to extract the text. The finished image is stored in your gallery.
Can it handle a long PDF?
Yes, with a caveat. Long text is condensed to its key points, so a single infographic gives an overview. To keep more detail, generate several infographics from the same PDF: the text is split between them, up to 10 at a time.
Does it work with scanned PDFs?
Not if the scan is only an image. The tool needs selectable text. If you can select and copy text in the PDF, it will work. Otherwise, run the file through OCR first.
More ways to use it
- Meeting notes to infographic
- Transcript to infographic
- Book summary infographic
- AI infographic generator
- All examples
Have the text ready?
Your first infographic is free, no card needed. After that, packs start at $6.99 for 5. No subscription.