 AI Infographic Maker
How to Turn a Blog Post into an Infographic
Repurpose a blog post into a shareable infographic (or carousel) — how to find the visual story in your writing and generate it fast.
Published August 11, 2026
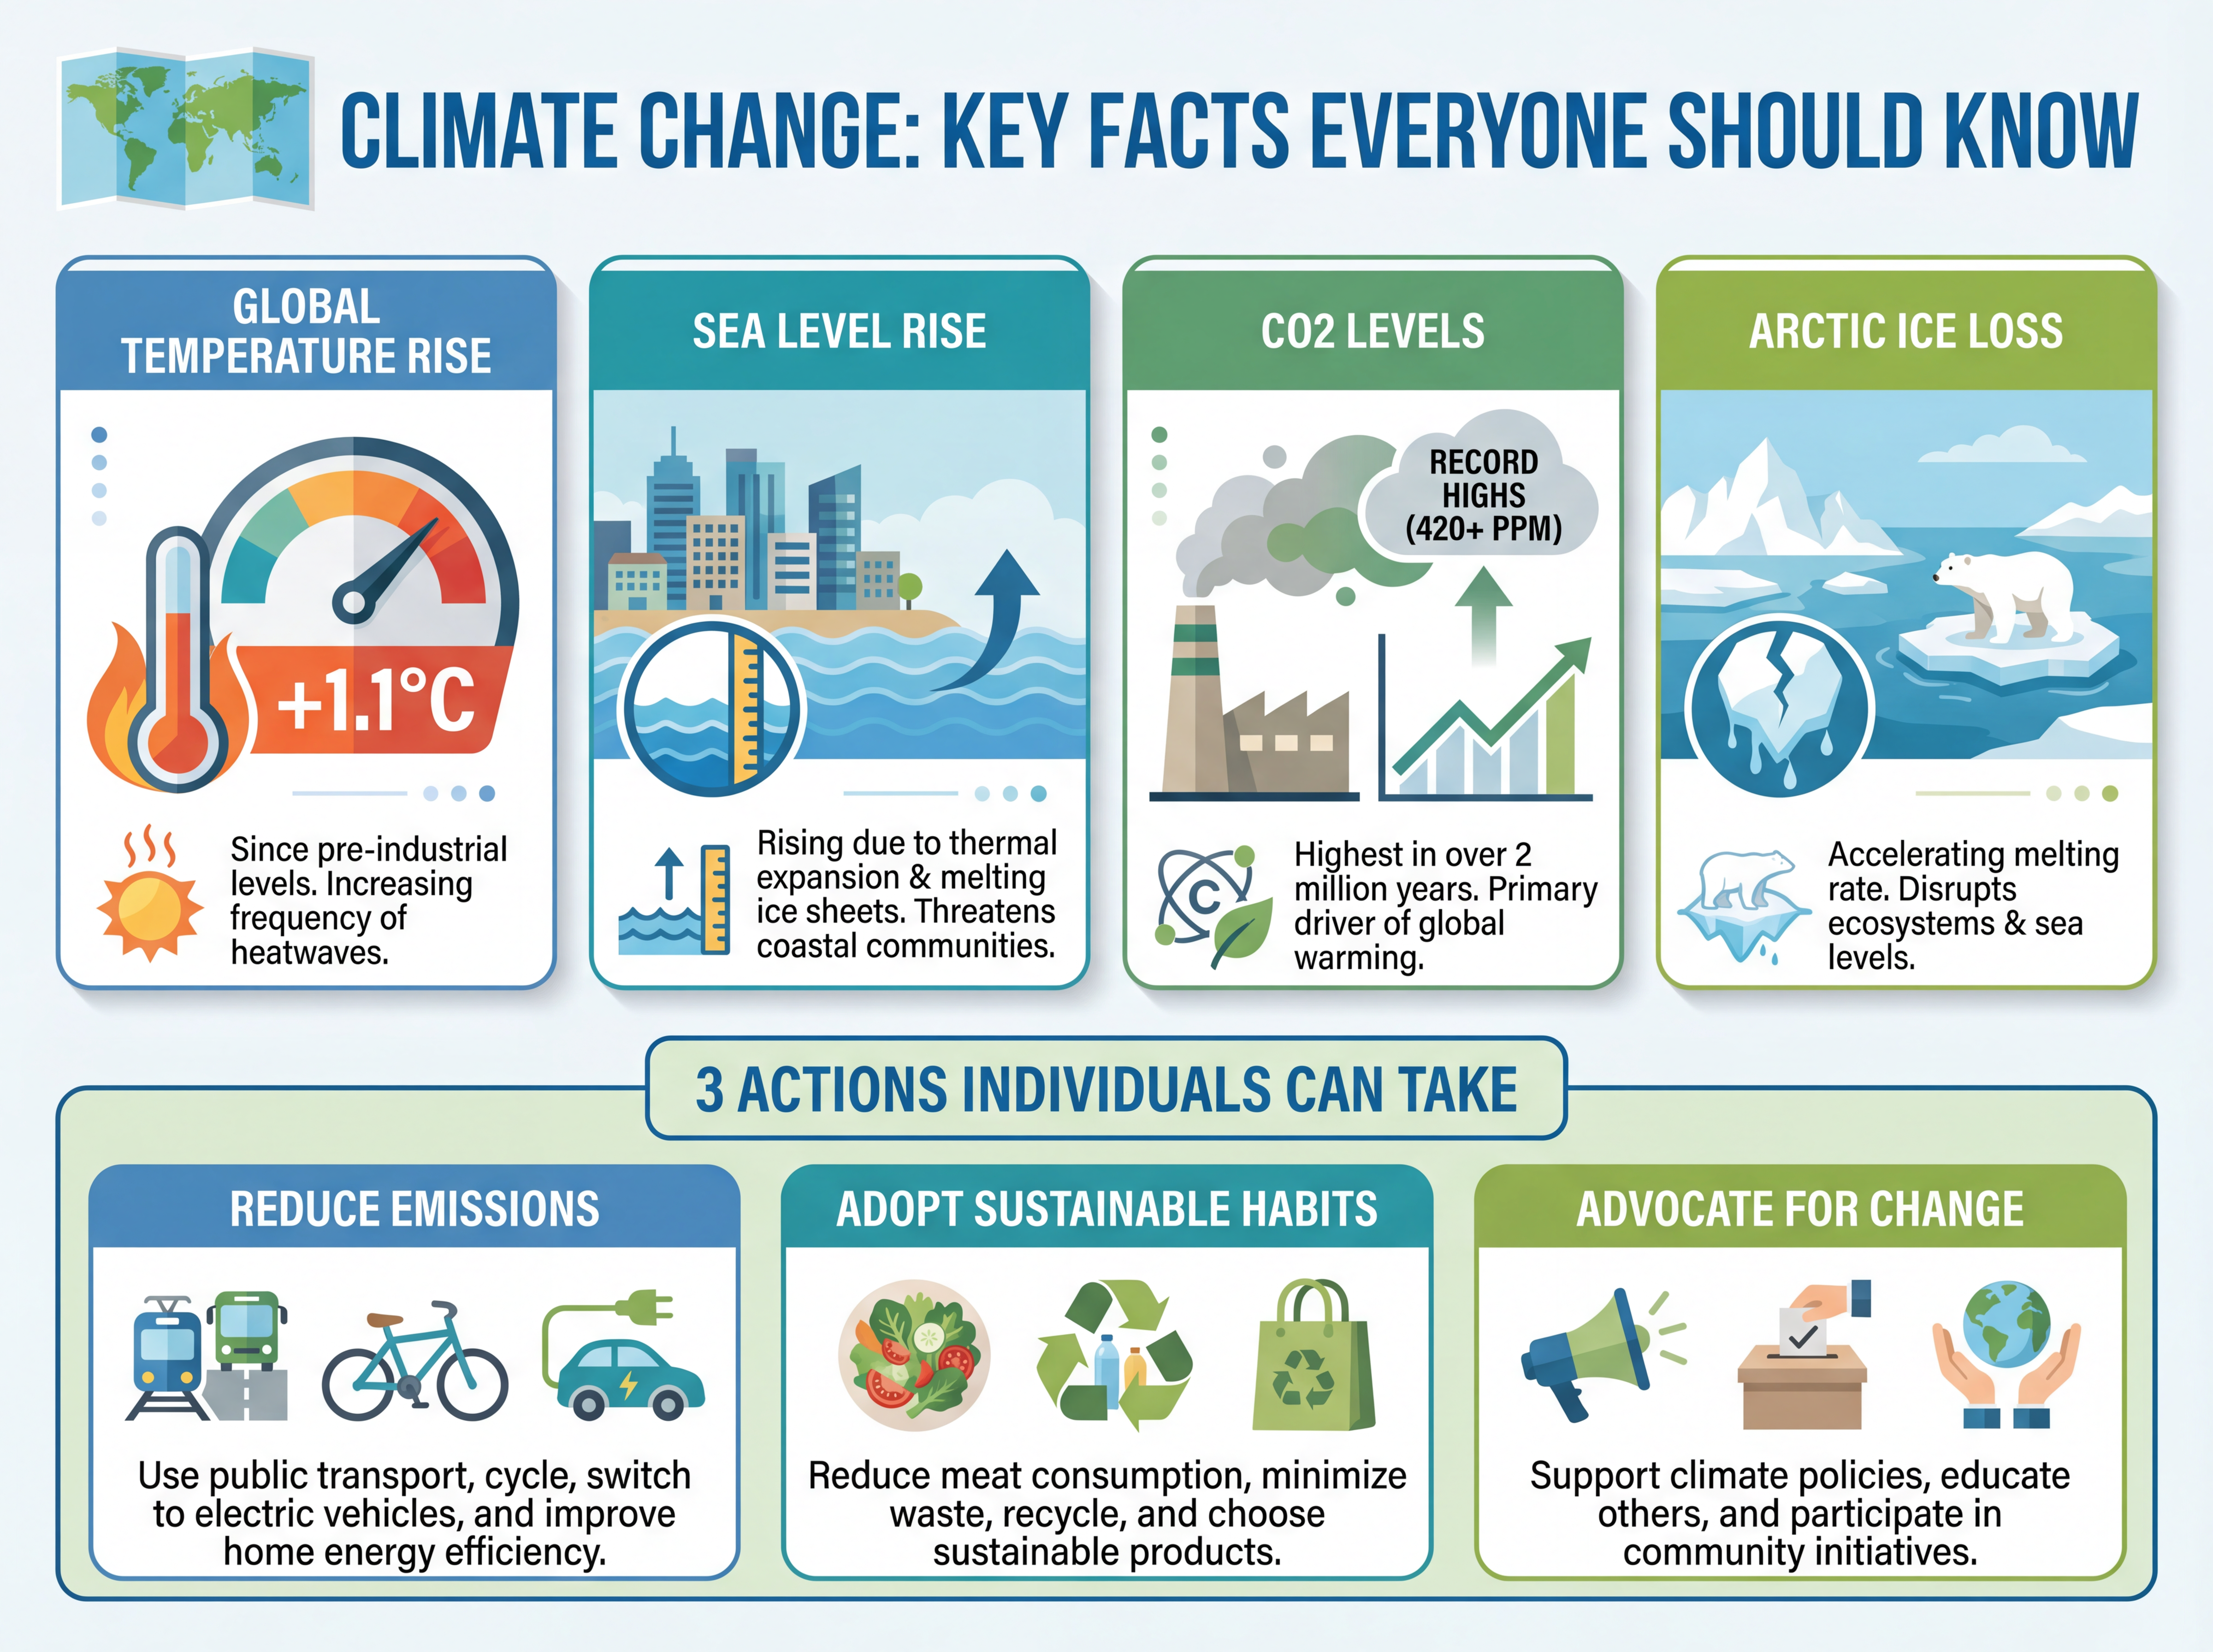
Every blog post you've written is unpublished visual content waiting to happen. Repurposing one into an infographic extends its reach to feeds where nobody reads 1,500 words — and it's fast, because the thinking is already done. The skill is spotting the visual story inside your writing.
Find the visual story
Most posts contain one of these, ready to lift out:
- A single takeaway → one infographic.
- A list ("7 ways to…") → a carousel, one item per slide.
- A process (step 1, 2, 3…) → a numbered visual.
- A comparison → a side-by-side graphic.
If you can name which one your post is, you already have the layout.
Extract, don't rewrite
Pull the headline and 4–7 supporting points. Drop the intros, transitions, and anything that doesn't survive being cut to a single line. The infographic is a trailer for the post — not the post.
Step by step
- Find the visual story (takeaway, list, process, or comparison).
- Extract the headline + 4–7 points.
- Choose a single image or a carousel.
- Generate and match your brand colors.
- Link back to the full post to drive traffic.
Close the loop
Always point the infographic back to the original post — a line like "Full guide in the link." The graphic earns the reach; the article earns the visit.